
Spot Explosive Momentum at the Exact Moment It Begins
Enter the strongest waves early, skip the weak ones instantly, and never second-guess corrective pauses again – all powered by real-time price, velocity, and volume analysis.

You’re frustrated because...
• By the time you act, the price has already surged.
A strong move begins, but you’re never sure when to jump in – wait for confirmation and half the move is gone, enter too early and a small pause wipes your stop. It feels like the market is always one step ahead.• You can’t tell when a pause ends.
Price rises, stalls, and you’re left guessing: “Is the pullback finished? Will it continue or reverse?” Without a way to measure it, entries become late, risky, or completely mistimed.• It’s hard to distinguish real momentum from temporary pauses.
Charts are full of pushes and dips, but not all of them matter. Weak moves can hide real impulse, while strong ones can collapse instantly – leading to missed trades, poor timing, and growing doubt in your approach.
You’ve probably tried…

Momentum indicators

Volume overlays
Candle patterns

Manual wave drawing
...yet none tell you exactly when real momentum returns after a pause. But, the real problem is...
You have no way to quantify the true strength & speed of each move in real time.
Without knowing which moves carry real intent, every entry feels like a guess — and the strongest waves pass by before you can react.
Explore ImpulseWave Radar
Powered by the Impulse 3-Wave Analyzer
It’s built to help you:
• See the exact moment a real impulse forms
• Know when a pause has finished
• Gauge real-time market strength at a glance
• Reduce false signals by filtering out weak movesThat’s what ImpulseWave Radar brings to your charts!
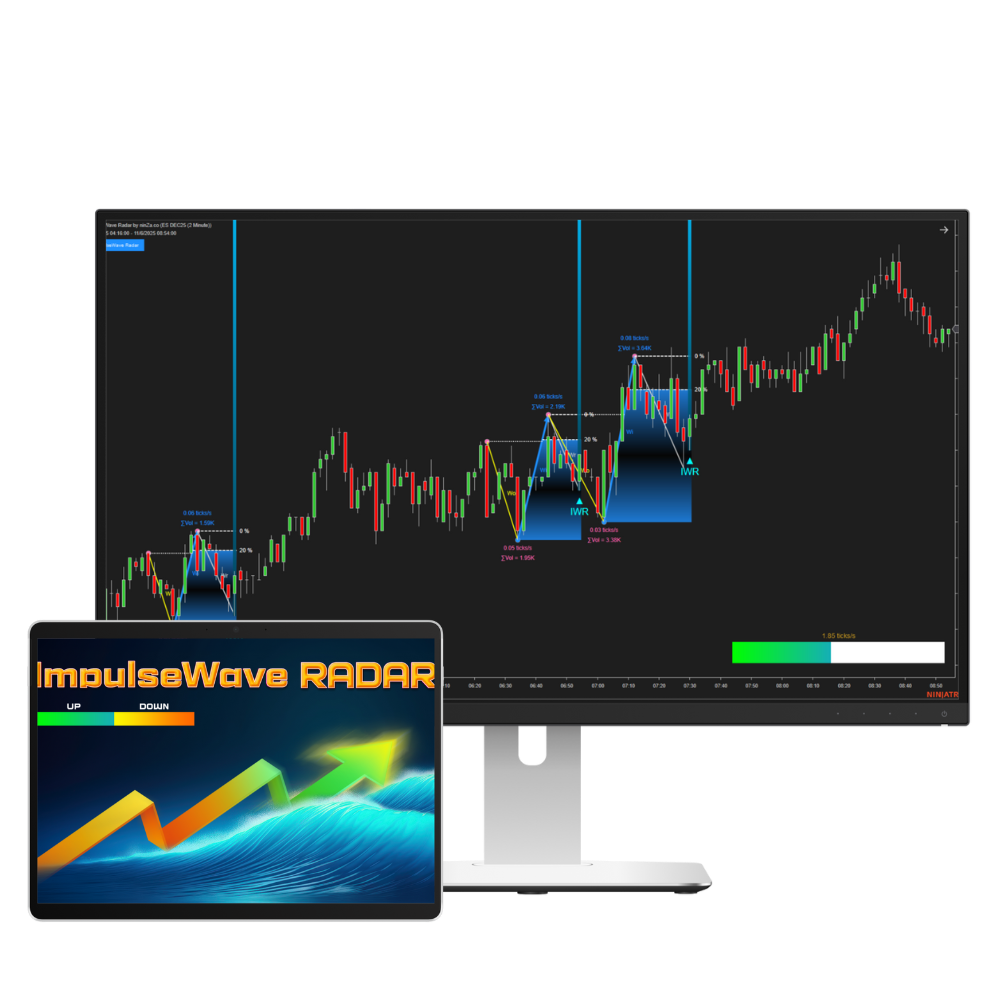
ImpulseWave Radar detects 3-Wave Structure (Wo → Wi → Wr)
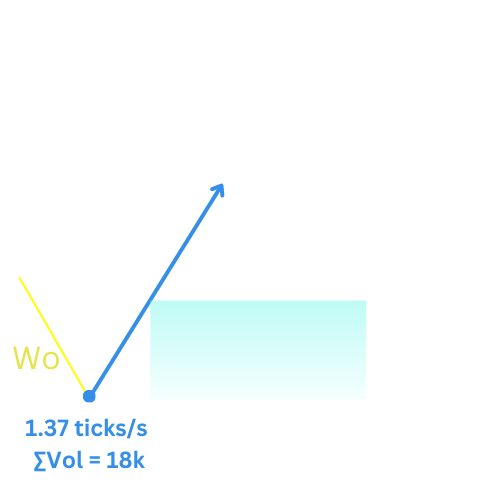
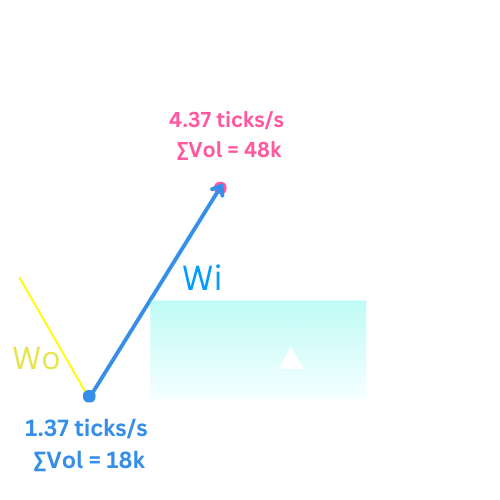
Base Wave (Wo)
The prior move that sets the context

Impulse Wave (Wi)
The 1st real surge that breaks the base wave structure
Correction Wave (Wr)
A brief pause that stays within Wi’s range, confirming momentum is still intact before signaling a trade entry
Unlike traditional wave-based indicators that look at price in isolation, ImpulseWave Radar references the prior wave (W0) to validate whether Wi is a true surge. This proprietary logic ensures weak or misleading moves are filtered out, while the strongest waves are detected early, before most traders even see them.The science behind it comes from Elliott Wave principles: The 3rd Wave in a series is typically the strongest. The Dynamic 3-Wave Analyzer applies this concept to real-time market data, combining price structure + volume + speed to create signals with greater reliability than standard momentum or volume indicators.
This means you:
• See exactly when a strong wave forms
• Receive signals right after the pullback for the earliest reliable entries
• Skip manual speed, volume, and wave calculations
• Focus on making trading decisions instead of constantly scanning charts
From Base Wave to Impulse: Spot strong moves EARLY
Now that you understand the logic, see how each feature identifies and validates the strongest waves in real time.


Automatically Detects the 3-Wave Structure
(Wo → Wi → Wr)
ImpulseWave Radar leverages proprietary logic combining price action, volume, and velocity to automatically identify the base (Wo), impulse (Wi), and corrective (Wr) waves.Most traditional indicators overlook the base wave, making it hard to spot true impulsive moves.→ You can enter trades at the foot of strong waves, capturing explosive moves while reducing guesswork.

Velocity (tick/s) and Volume Analysis
The indicator compares the speed (ticks/s) and total volume of the impulse wave (Wi) with the prior base wave (Wo), only validating Wi when it moves faster and with higher volume.This ensures the wave has real momentum, not just a minor fluctuation.→ You can identify genuine impulse waves and enter at the very start of explosive moves, maximizing potential rewards before the market accelerates.

Correction Wave (Wr) Validation
The indicator confirms corrective waves (Wr) only when their pullbacks stay within the validated range of the impulse wave (Wi), filtering out any moves beyond this boundary.This is important because out-of-range retracements can break the wave structure and mislead entries.→ It helps preserve the initial momentum, avoid false signals, and reduce the risk of mistimed trades.
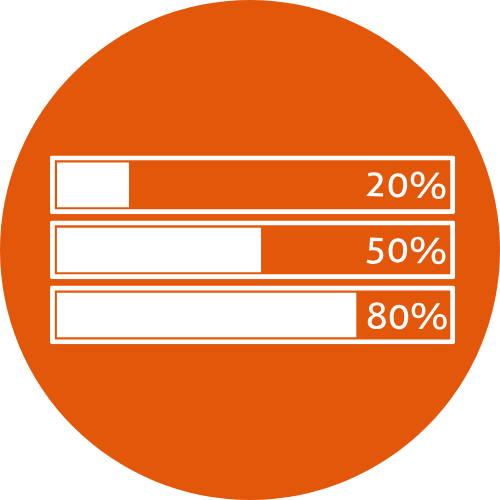
Strength Bar (Ticks/s)
This advanced feature turns the indicator into a real-time tool for analyzing market intensity.The momentum bar directly measures ticks/s data (the number of trades or price changes per second) on each candle, giving a visual, quantifiable view of market momentum.→ Higher bars indicate faster price movement and stronger buying or selling pressure, helping you gauge trend strength at a glance.
This is how ImpulseWave Radar identifies potential buy signals:


Watch how ImpulseWave Radar spots potential sell signals:


[Webinar Replay] Dynamic 3-wave analyzer for explosive momentum
In this webinar, our pro trader Harry Lee will break down the 3-wave signal mechanism behind ImpulseWave Radar. He’ll explain why we chose this pattern, share backtest results, and provide several useful trading tips.

Real trades. Real performance.
In this session, Harry focused on capturing fewer trades with much higher reward, exactly in the spirit of what the indicator is designed to deliver.
Even with fewer entries, the performance is just as strong, or even better, thanks to the high-reward nature of the signals from ImpulseWave Radar.
In this recording, ImpulseWave Radar delivered 28 consecutive accurate signals within just 2 hours, clearly showcasing its precision and real-world performance.
This video includes the following sections:
• A quick overview of how ImpulseWave Radar generates signals.
• Live trading examples using the indicator.
• A visual highlight of early-wave signals that offer high reward.
Our serious traders have some feedback:

Check out the latest 1-month & 2-month backtest results of ImpulseWave Radar on the 100-tick NQ chart:


Check out the latest 2-month backtest results of ImpulseWave Radar on the 100-tick YM chart:


ImpulseWave Radar caught a real-time high-reward signal. One trade, +300 ticks! 🚀


As the saying goes, waves within waves. During today’s Asian session, ImpulseWave Radar generated a signal that captured a major bearish move of 300 ticks using the large-cycle setting, designed to catch big wave signals with large swing points.In addition, with a smaller-cycle setting, the indicator also identified two smaller waves within this larger wave.


Another successful +100 ticks high-reward trade in just one single trade with ImpulseWave Radar


Look how ImpulseWave Radar's signals align with Captain Optimus Strong's signals:


Is it right for you? Let’s clear things up!
Even seeing these results, it’s natural to have questions. Here’s a closer look at common concerns.
A special offer for YOU today...
Core Power Option
• (1) ImpulseWave Radar license: $700 value
• Personalized support: $50 value
• 1-year product update: $140 value
• Trader's manual: $100 value
→ In total: $990, now only...
$278
Superior Bundle
• (1) ImpulseWave Radar license: $700 value
• (1) Romantick Pulse license: $600 value
• Personalized support: $50 value
• 1-year product update: $260 value
• Trader's manuals: $200 value
→ In total: $1810, now only...
$396
45-day confidence guarantee
Zero Risk. Total Confidence.Use the full indicator in real market conditions for 45 days – on your platform, your markets, and your trading style.If you don’t experience a clear improvement in your timing, clarity, or trade quality, we’ll exchange it for any other indicator you choose, with little to no fee.

You have to trade this effective pattern
This special pricing will end soon...
After that, the price will rise – and may climb again as we continue adding new features and training materials.